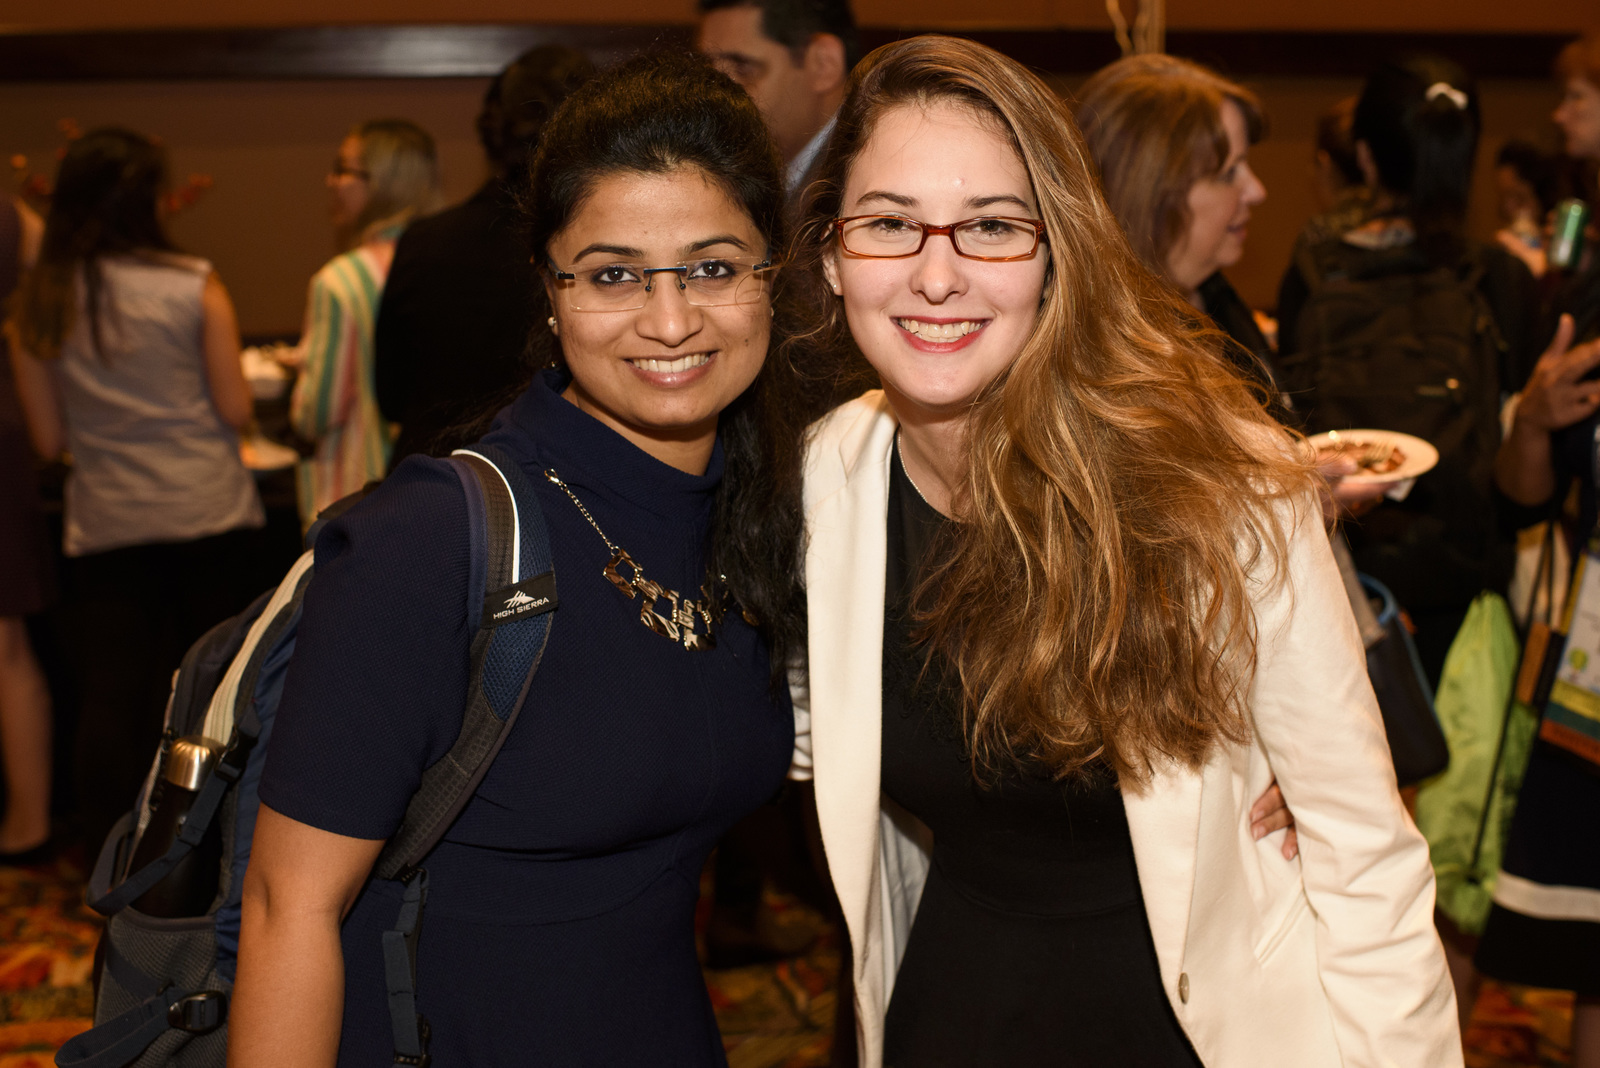
Grace Hopper Celebration (GHC) is the perfect opportunity for students to gain the resources they need to help them thrive in their careers, and for faculty to learn how best to help their students reach their goals. With so many sessions aimed specifically at academics, GHC is a life-changing experience that they won’t want to miss. To help as many people as possible attend the Celebration, AnitaB.org and our sponsoring organizations provide hundreds of scholarships each year to undergraduate students, graduate students, and faculty in computing and tech. These scholarships cover registration, travel, hotel, and meals, allowing our scholars to take advantage of everything GHC has to offer.
This year, we are sending a total of 910 student scholars to GHC 19, 133 of whom are international students. These students range from undergraduate students in their first year of college to graduate students earning their doctorate degrees. We offer plenty of sessions to meet the varying needs of these students, from our CRA-W sessions on thriving in graduate school to our Mentoring Circles where students can get quality career advice specific to their needs.
Our student scholars also come from diverse backgrounds. This year, we have scholars representing 69 different countries and 49† U.S. states/territories. You can also see a breakdown of the race and ethnicity of our accepted scholars in the chart below. We will be hosting numerous networking socials to celebrate our diverse groups of women technologists.
| Race/Ethnicity | Number of Student Scholars* | Percentage of Student Scholars** |
| African or African American/Black | 222 | 24.40% |
| Alaska Native or American Indian/Native American | 34 | 3.74% |
| Asian or Asian-American | 332 | 36.48% |
| European or Euro-American/White | 316 | 34.73% |
| Hispanic or Latinx | 143 | 15.71% |
| Native Hawaiian or Pacific Islander | 17 | 1.87% |
| Underrepresented Minority*** | 358 | 39.34% |
| Women of Color**** | 668 | 73.41% |
We are also sending 50 faculty scholars to GHC, where they will learn how to further their careers, as well as how to increase diversity within their departments. This year, we have faculty scholars representing 13 different countries and 25† U.S. states/territories. We will likewise offer multiple sessions aimed specifically at faculty, which you can view in our online schedule. You can view the race and ethnicity breakdown of our faculty scholars below.
| Race/Ethnicity | Number of Faculty Scholars* | Percentage of Faculty Scholars** |
| African or African American/Black | 12 | 24.00% |
| Alaska Native or American Indian/Native American | 2 | 4.00% |
| Asian or Asian-American | 14 | 28.00% |
| European or Euro-American/White | 24 | 48.00% |
| Hispanic or Latinx | 9 | 18.00% |
| Native Hawaiian or Pacific Islander | 1 | 2.00% |
| Underrepresented Minority*** | 18 | 36.00% |
| Women of Color**** | 30 | 60.00% |
Congratulations to all of our GHC 19 Scholars! We can’t wait to meet you in Orlando!
† Including Puerto Rico and The District of Columbia (D.C)
*Numbers are based on scholars’ self-reported information. Those who indicated more than one race or ethnicity are counted in both categories.
**Percentages do not add up to 100 because scholars were able to select more than one category.
***Includes any scholar who selected African or African American/Black, Hispanic/Latinx, Native Hawaiian/Pacific Islander, and/or Native American.
****Includes any scholar who selected African or African American/Black, Asian or Asian American, Hispanic/Latinx, Native Hawaiian/Pacific Islander, and/or Native American.


Laisser un commentaire
Vous devez vous connecter pour publier un commentaire.